Adams School
This chart shows solar production in five-minute increments throughout the day.
Data Source
Data back until
This chart shows solar production during the given year. The line chart has daily generation totals and the bar chart has monthly generation totals.
Data Source
Data back until
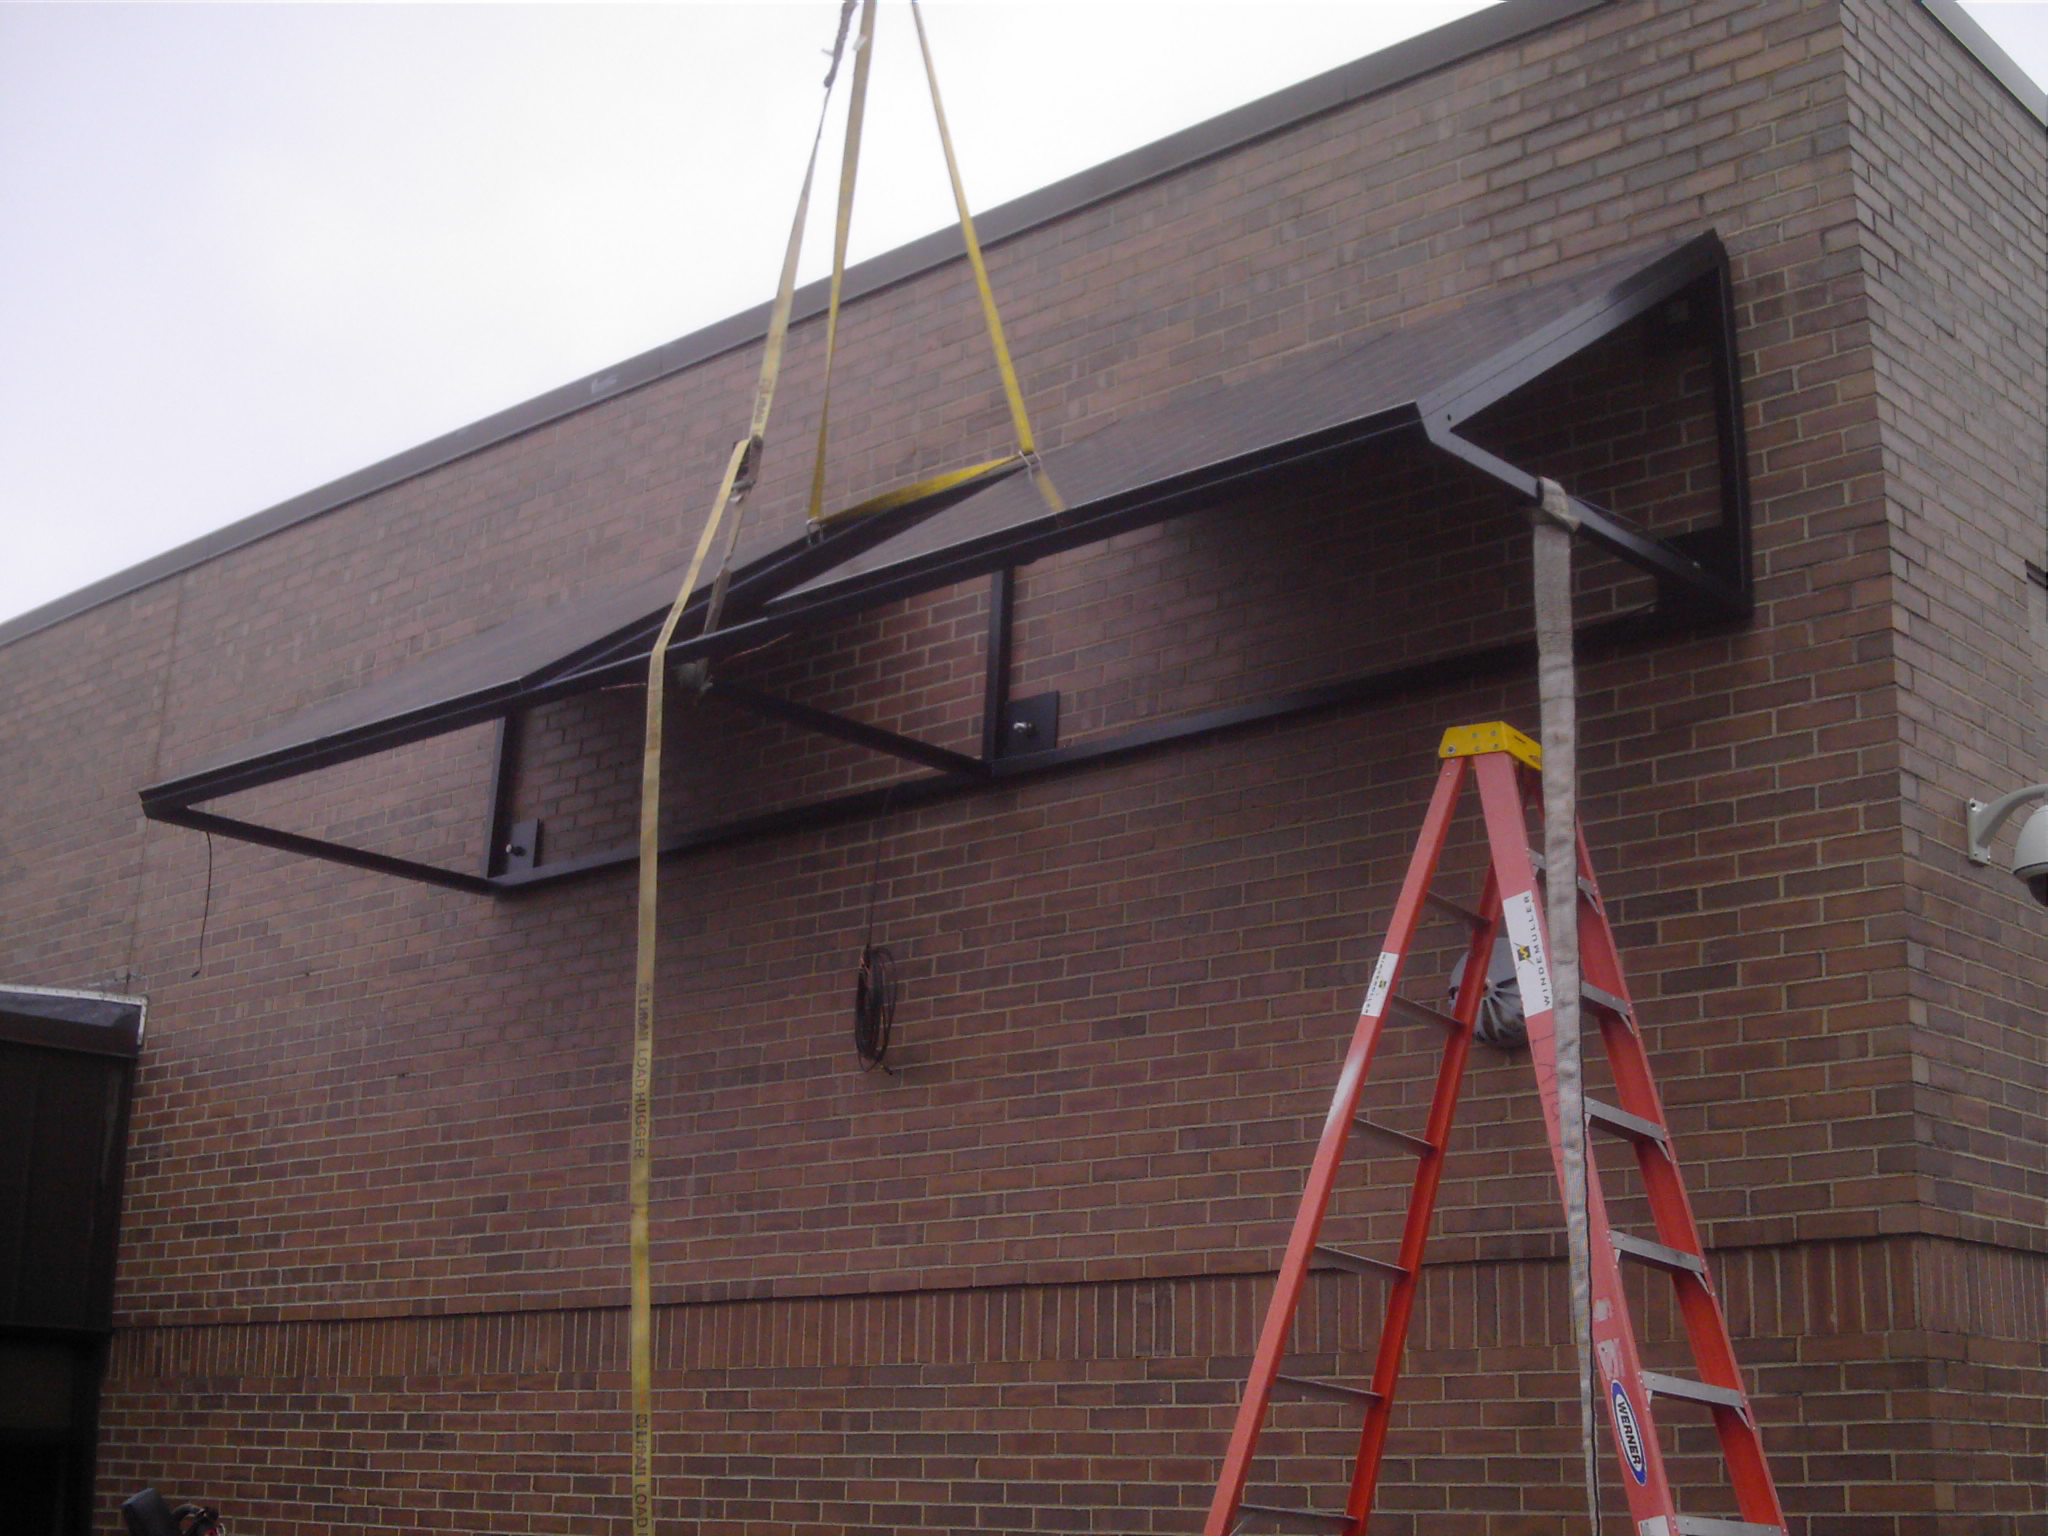
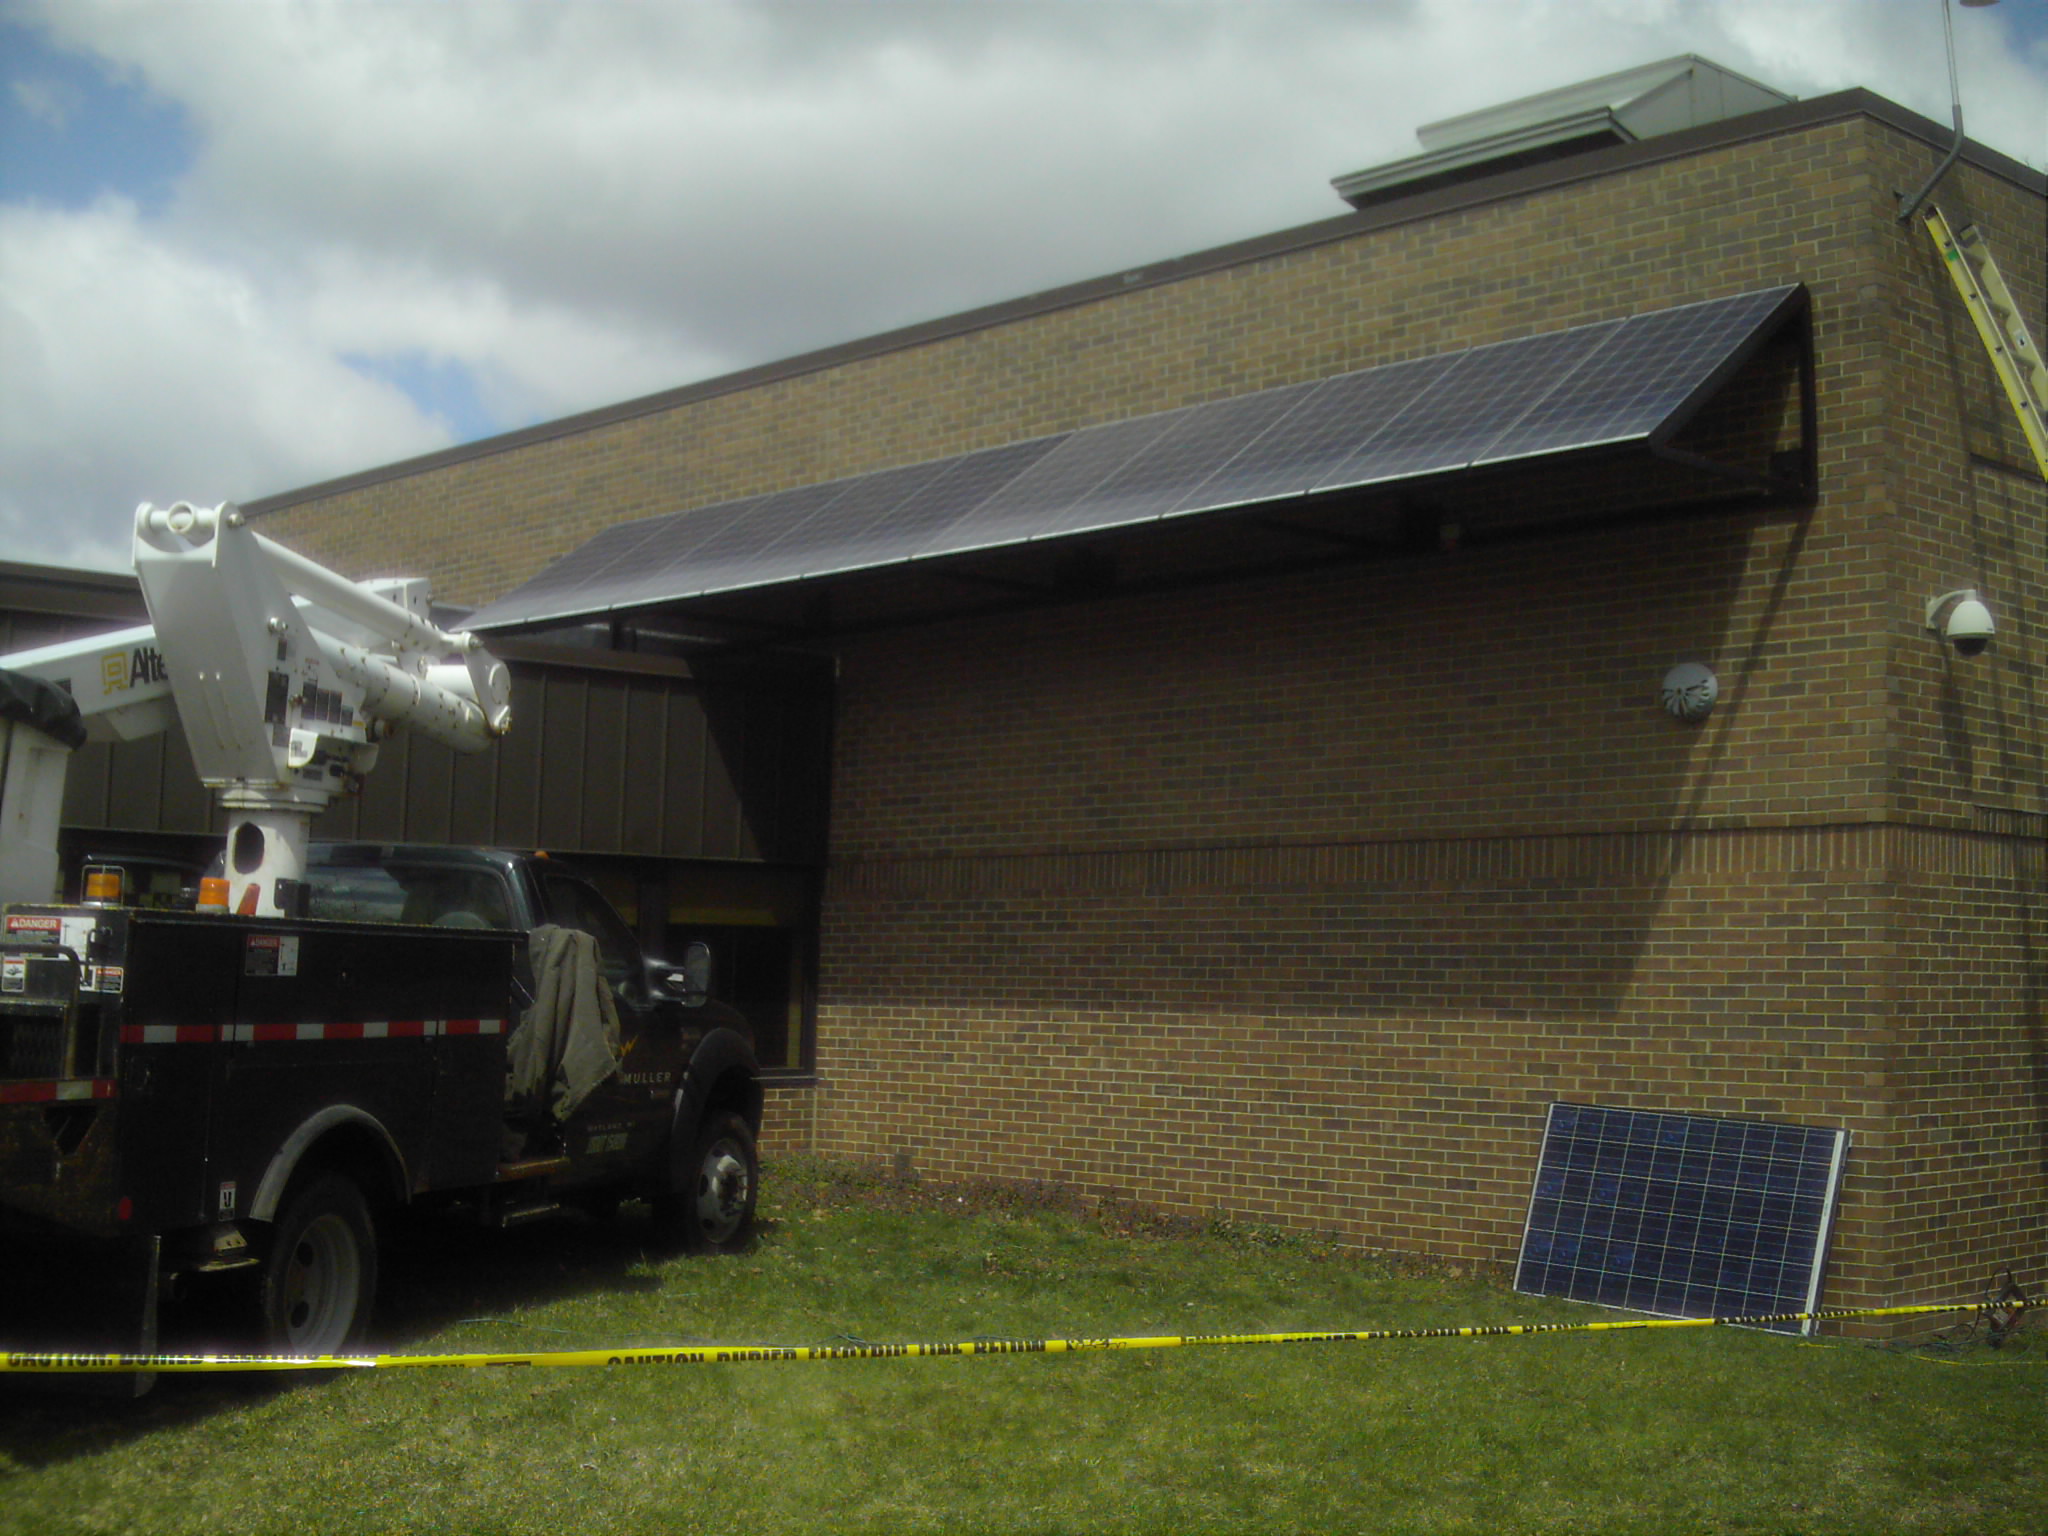
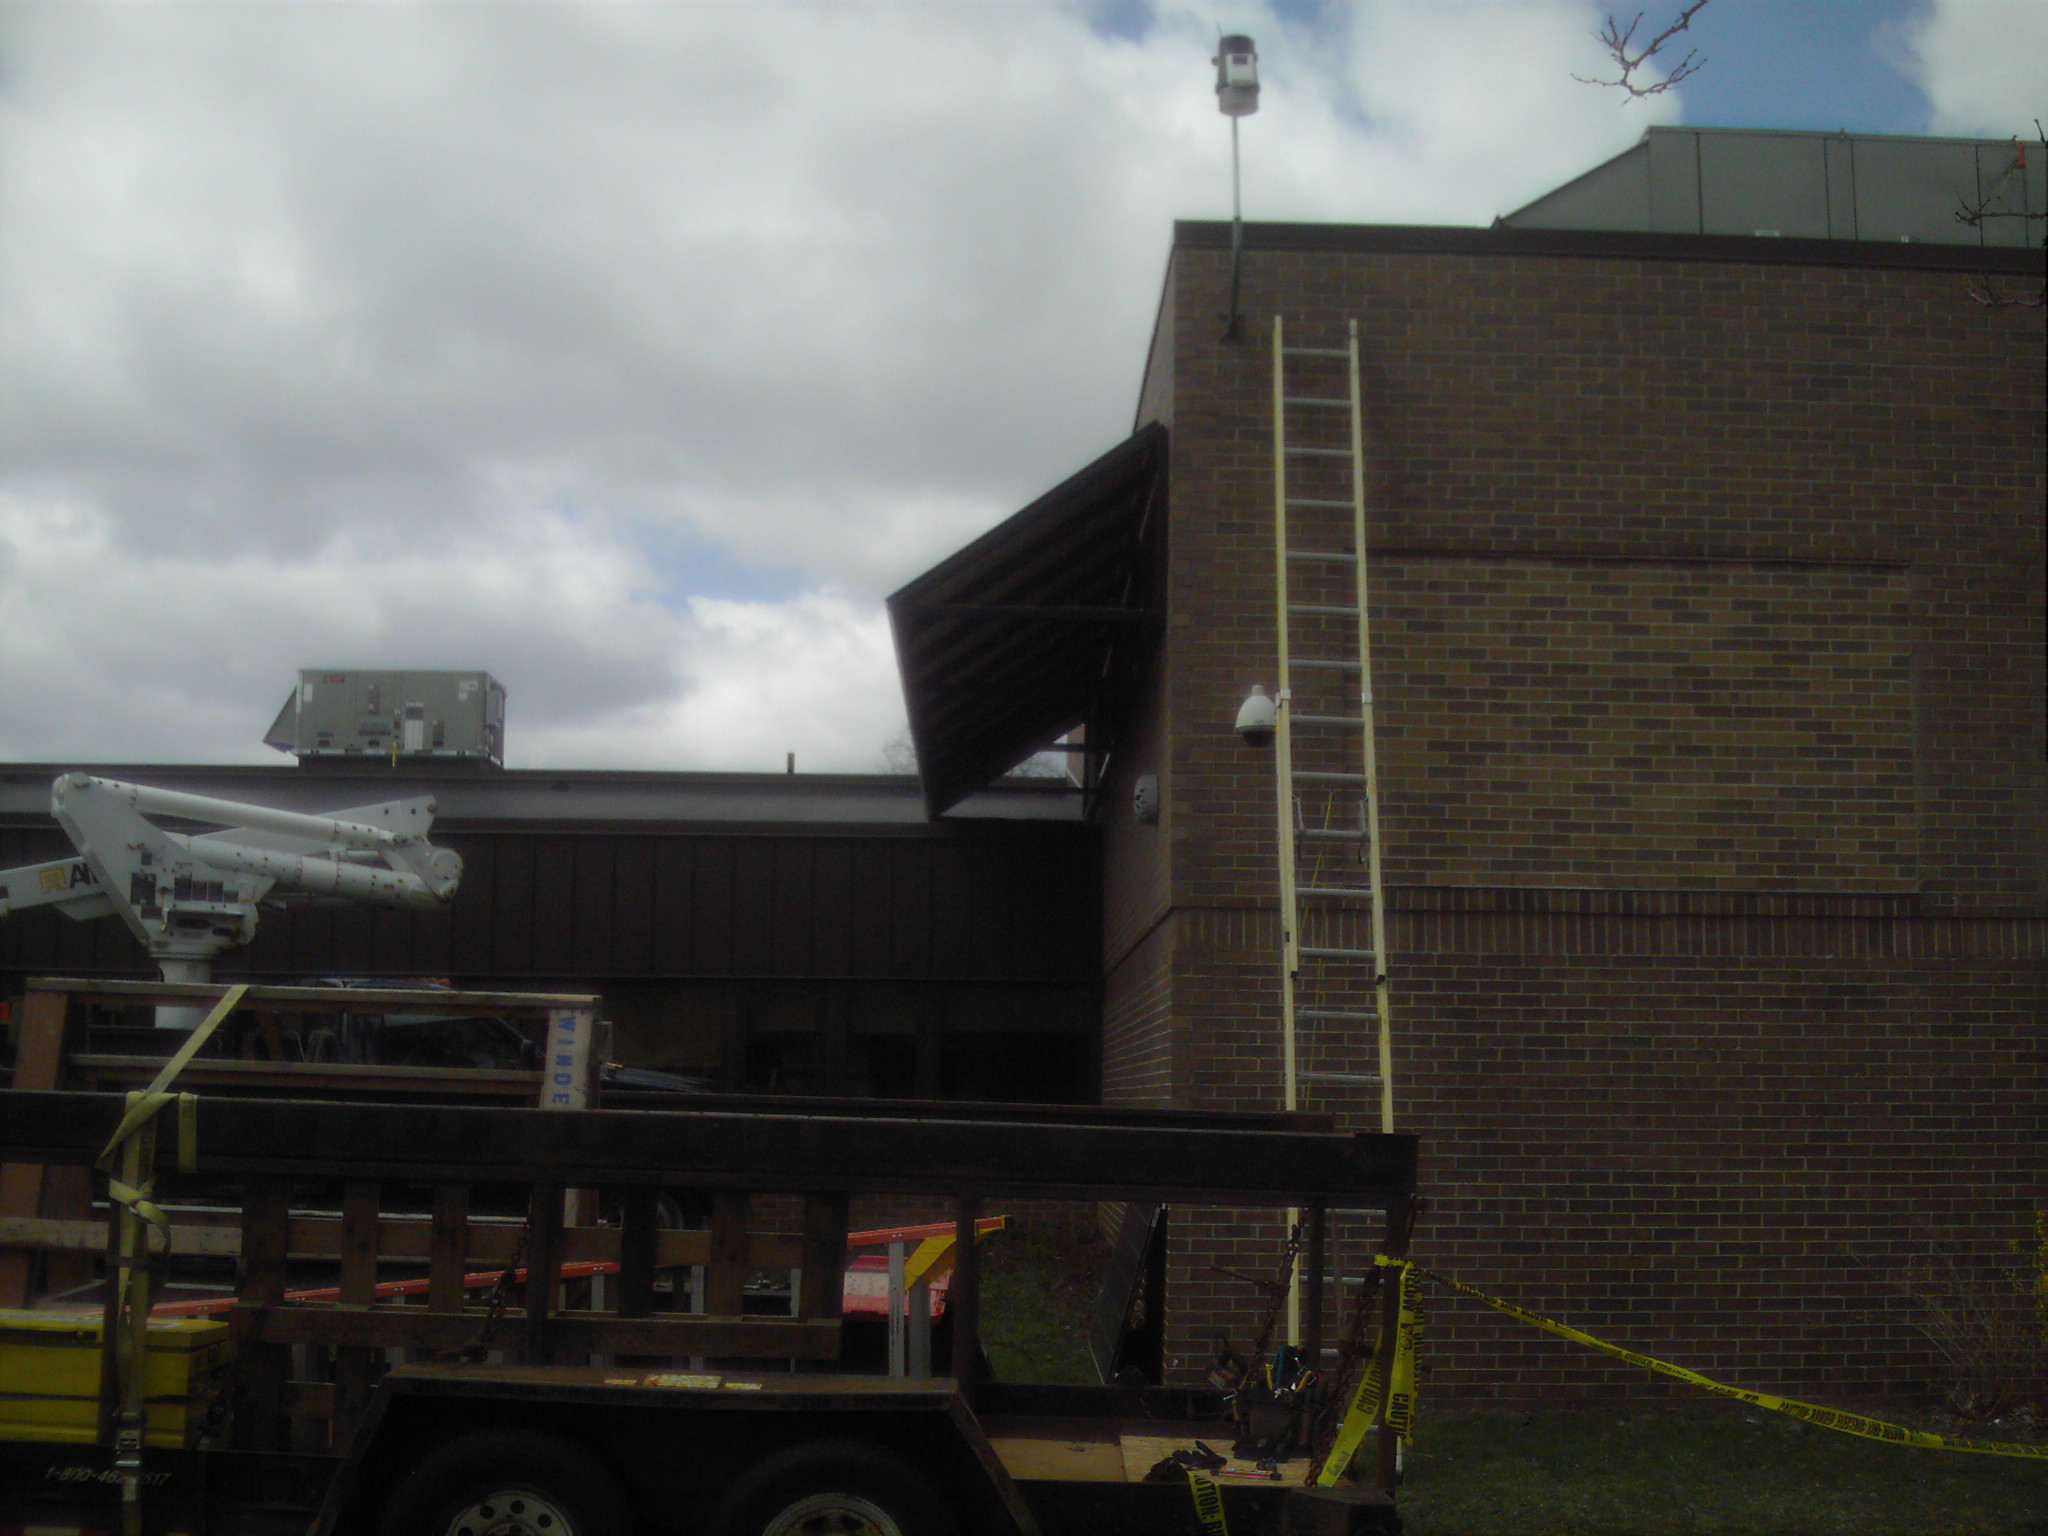
Installation Specifics
- Installation Type
- Public
- Installation Completed
- August 2011
- Number/Type of Panels
- 10 SolarWorld 240-watt solar panels
- Install Specs
- 38° facing South
- Size/Type of Inverter
- 3000-watt SunnyBoy inverter
- Installer
- Windemuller
- Rated Output
- 2400 W
- Contact
- Ypsilanti Public School District
Images
Click on an image for a larger view
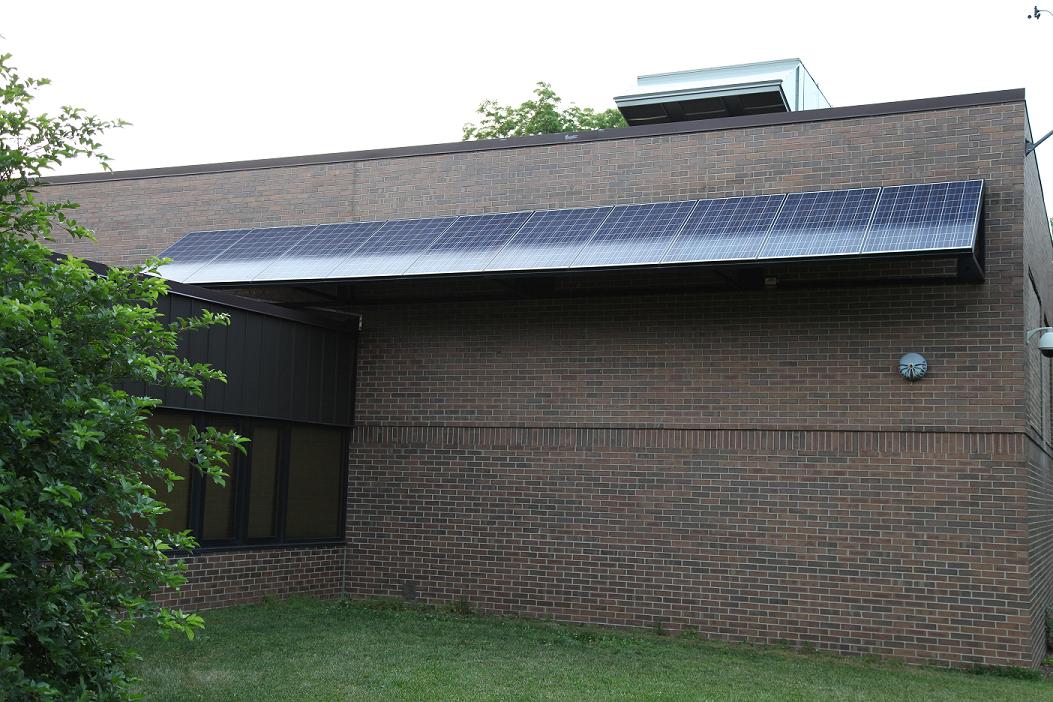
Final Installation
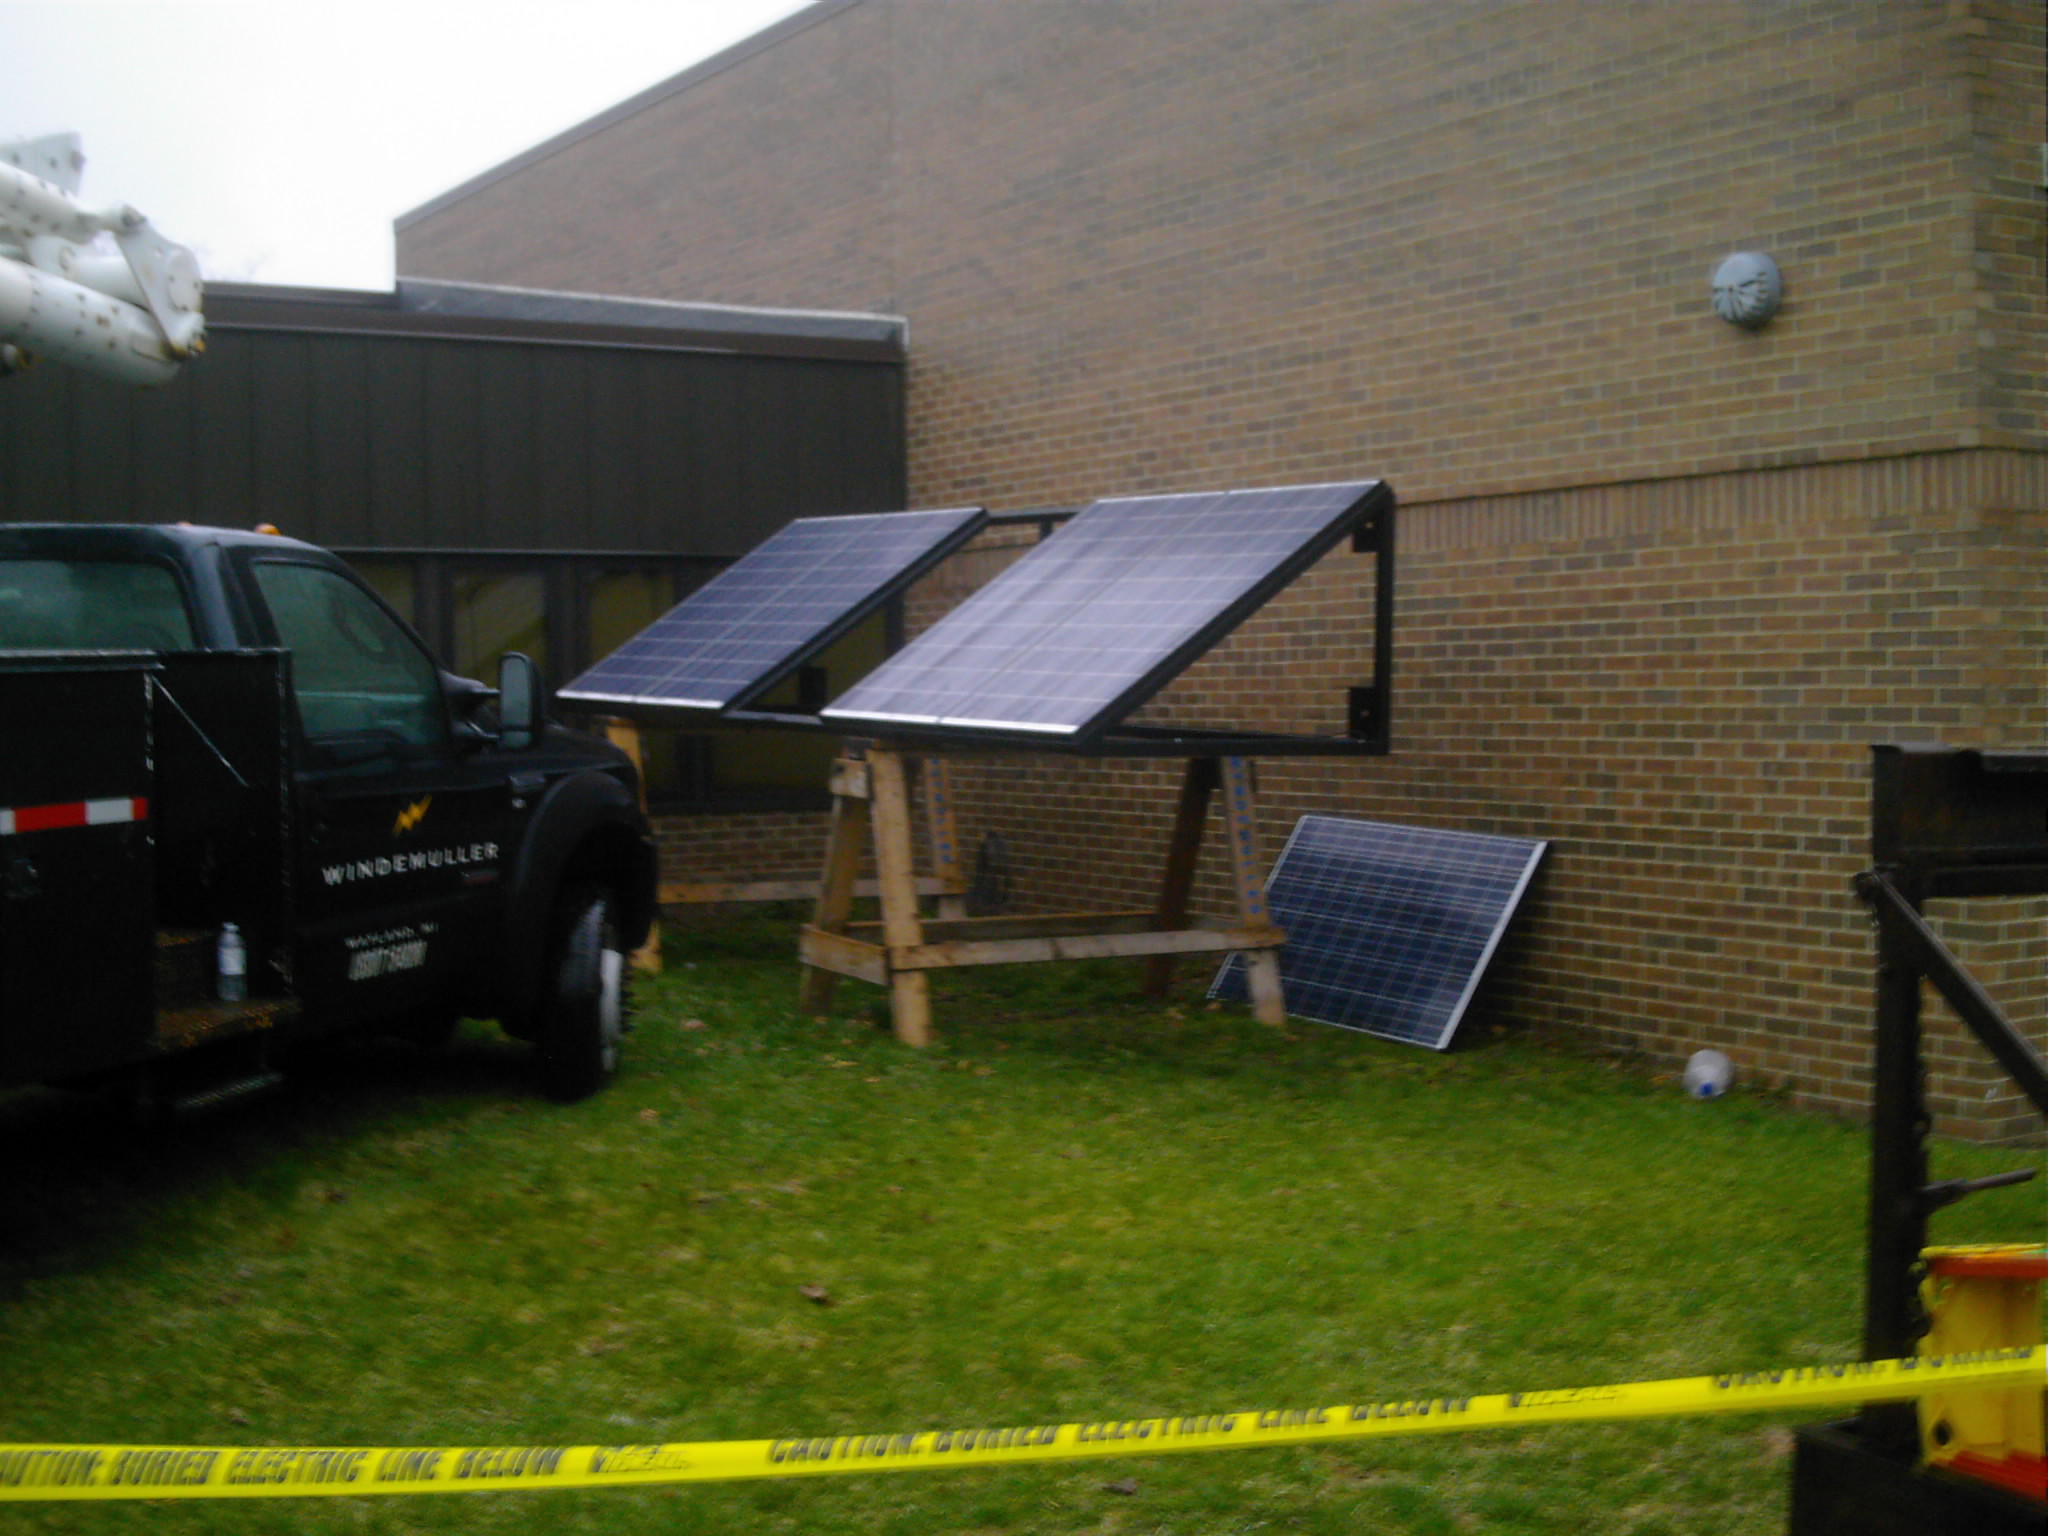
Solar Panel Installation

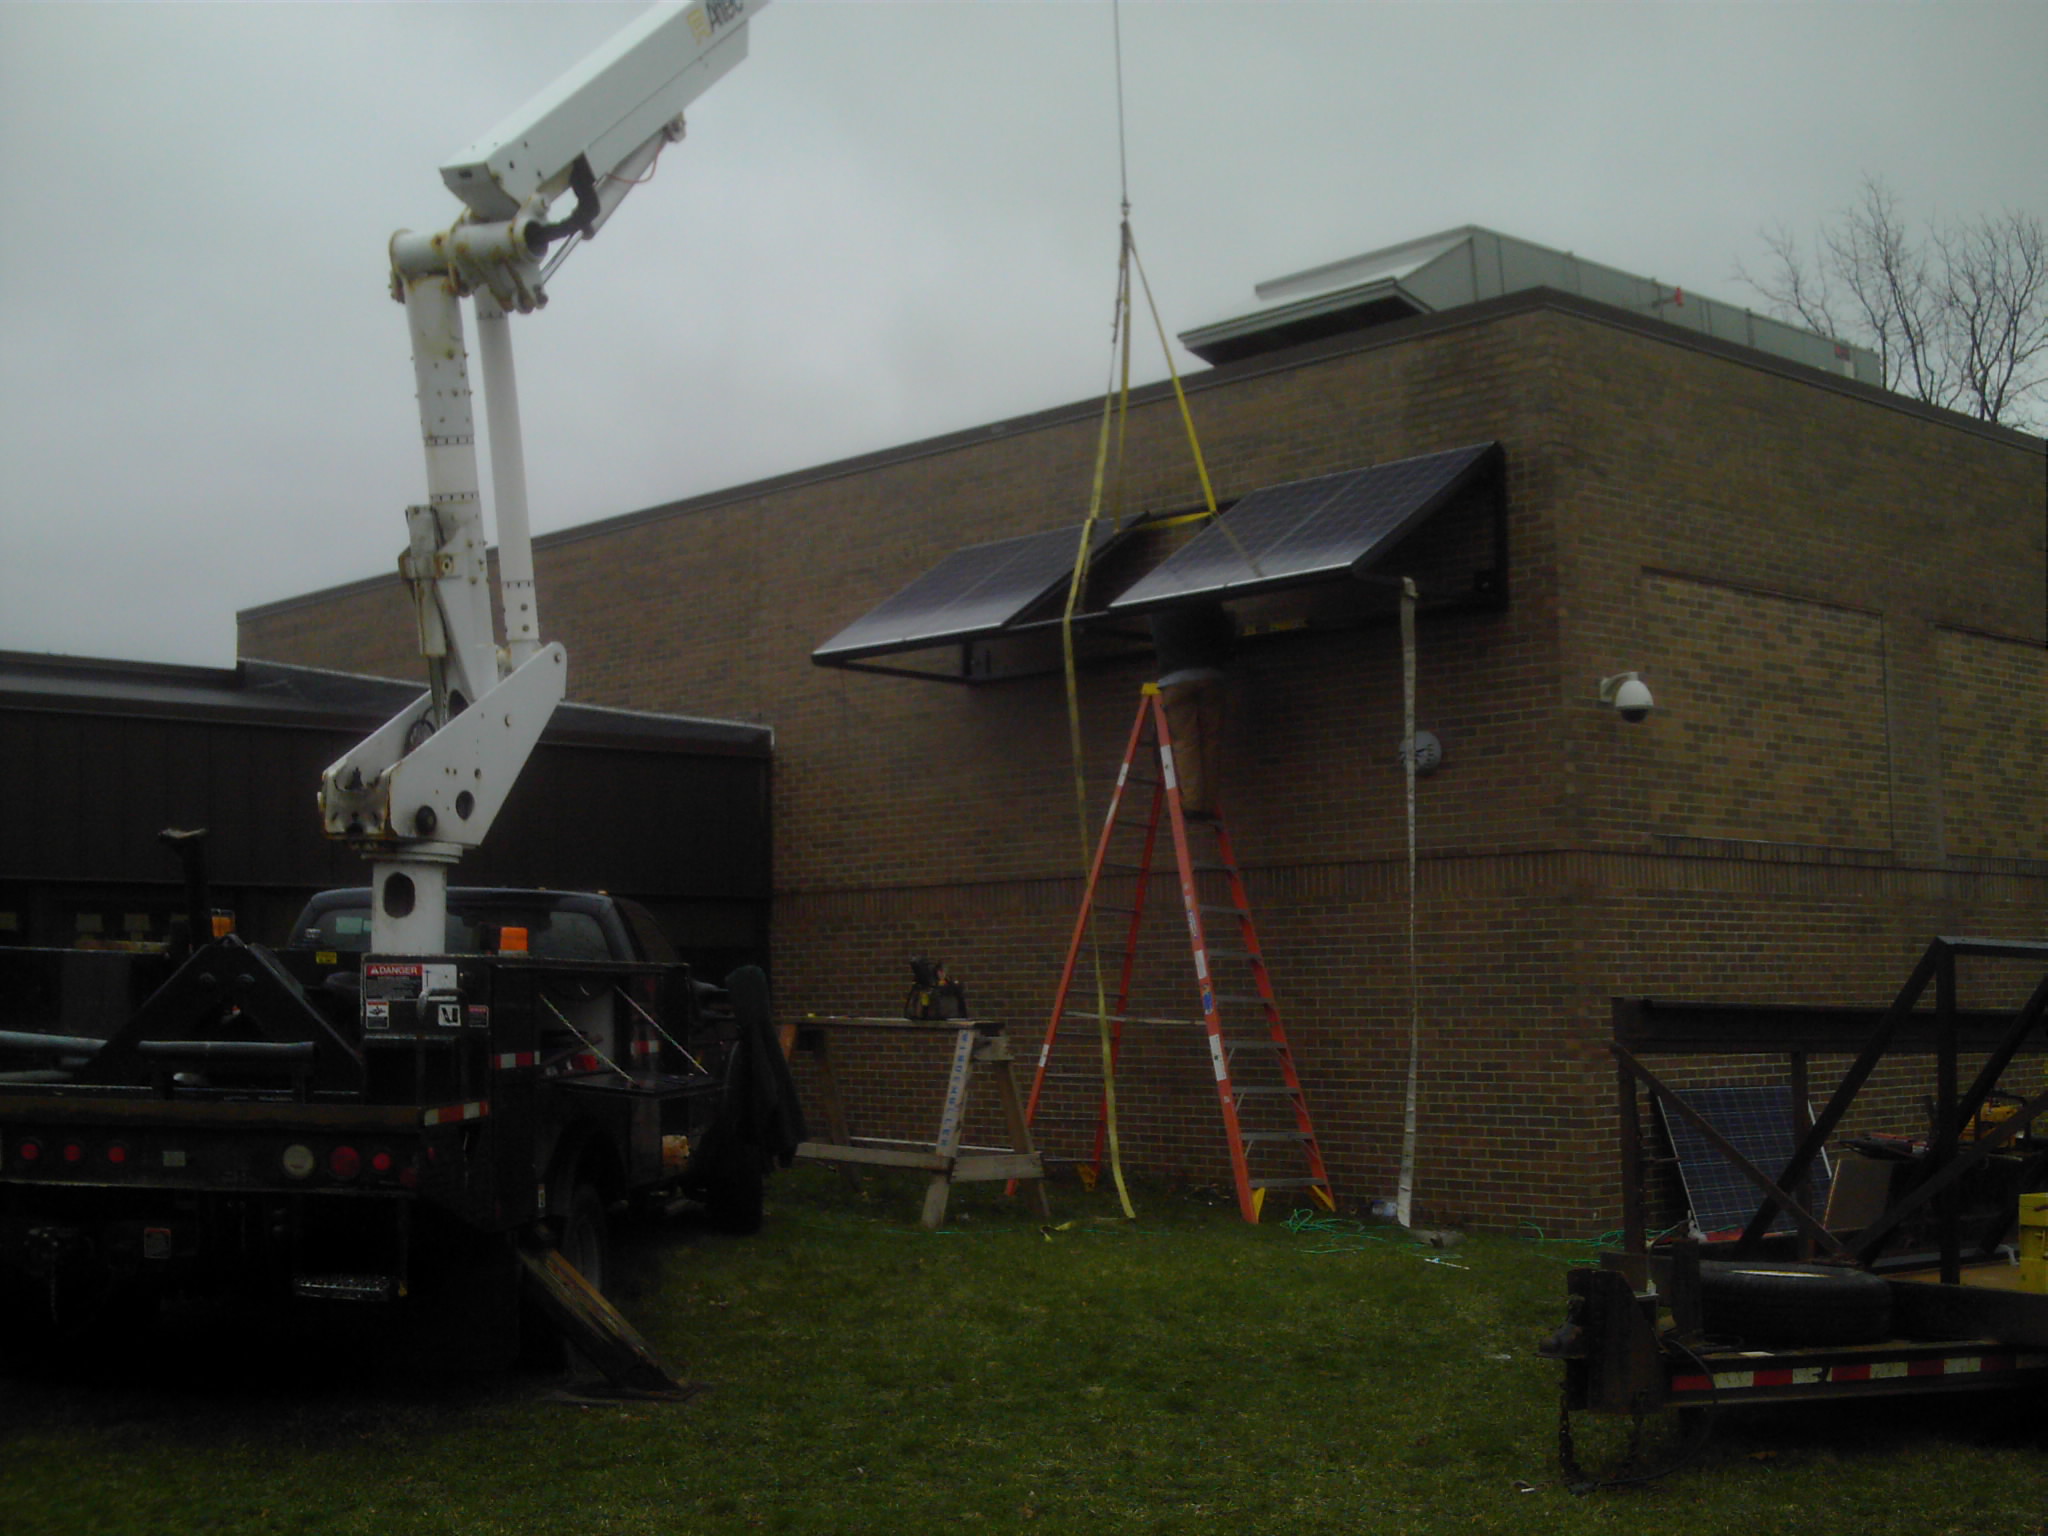
Solar Panel Installation

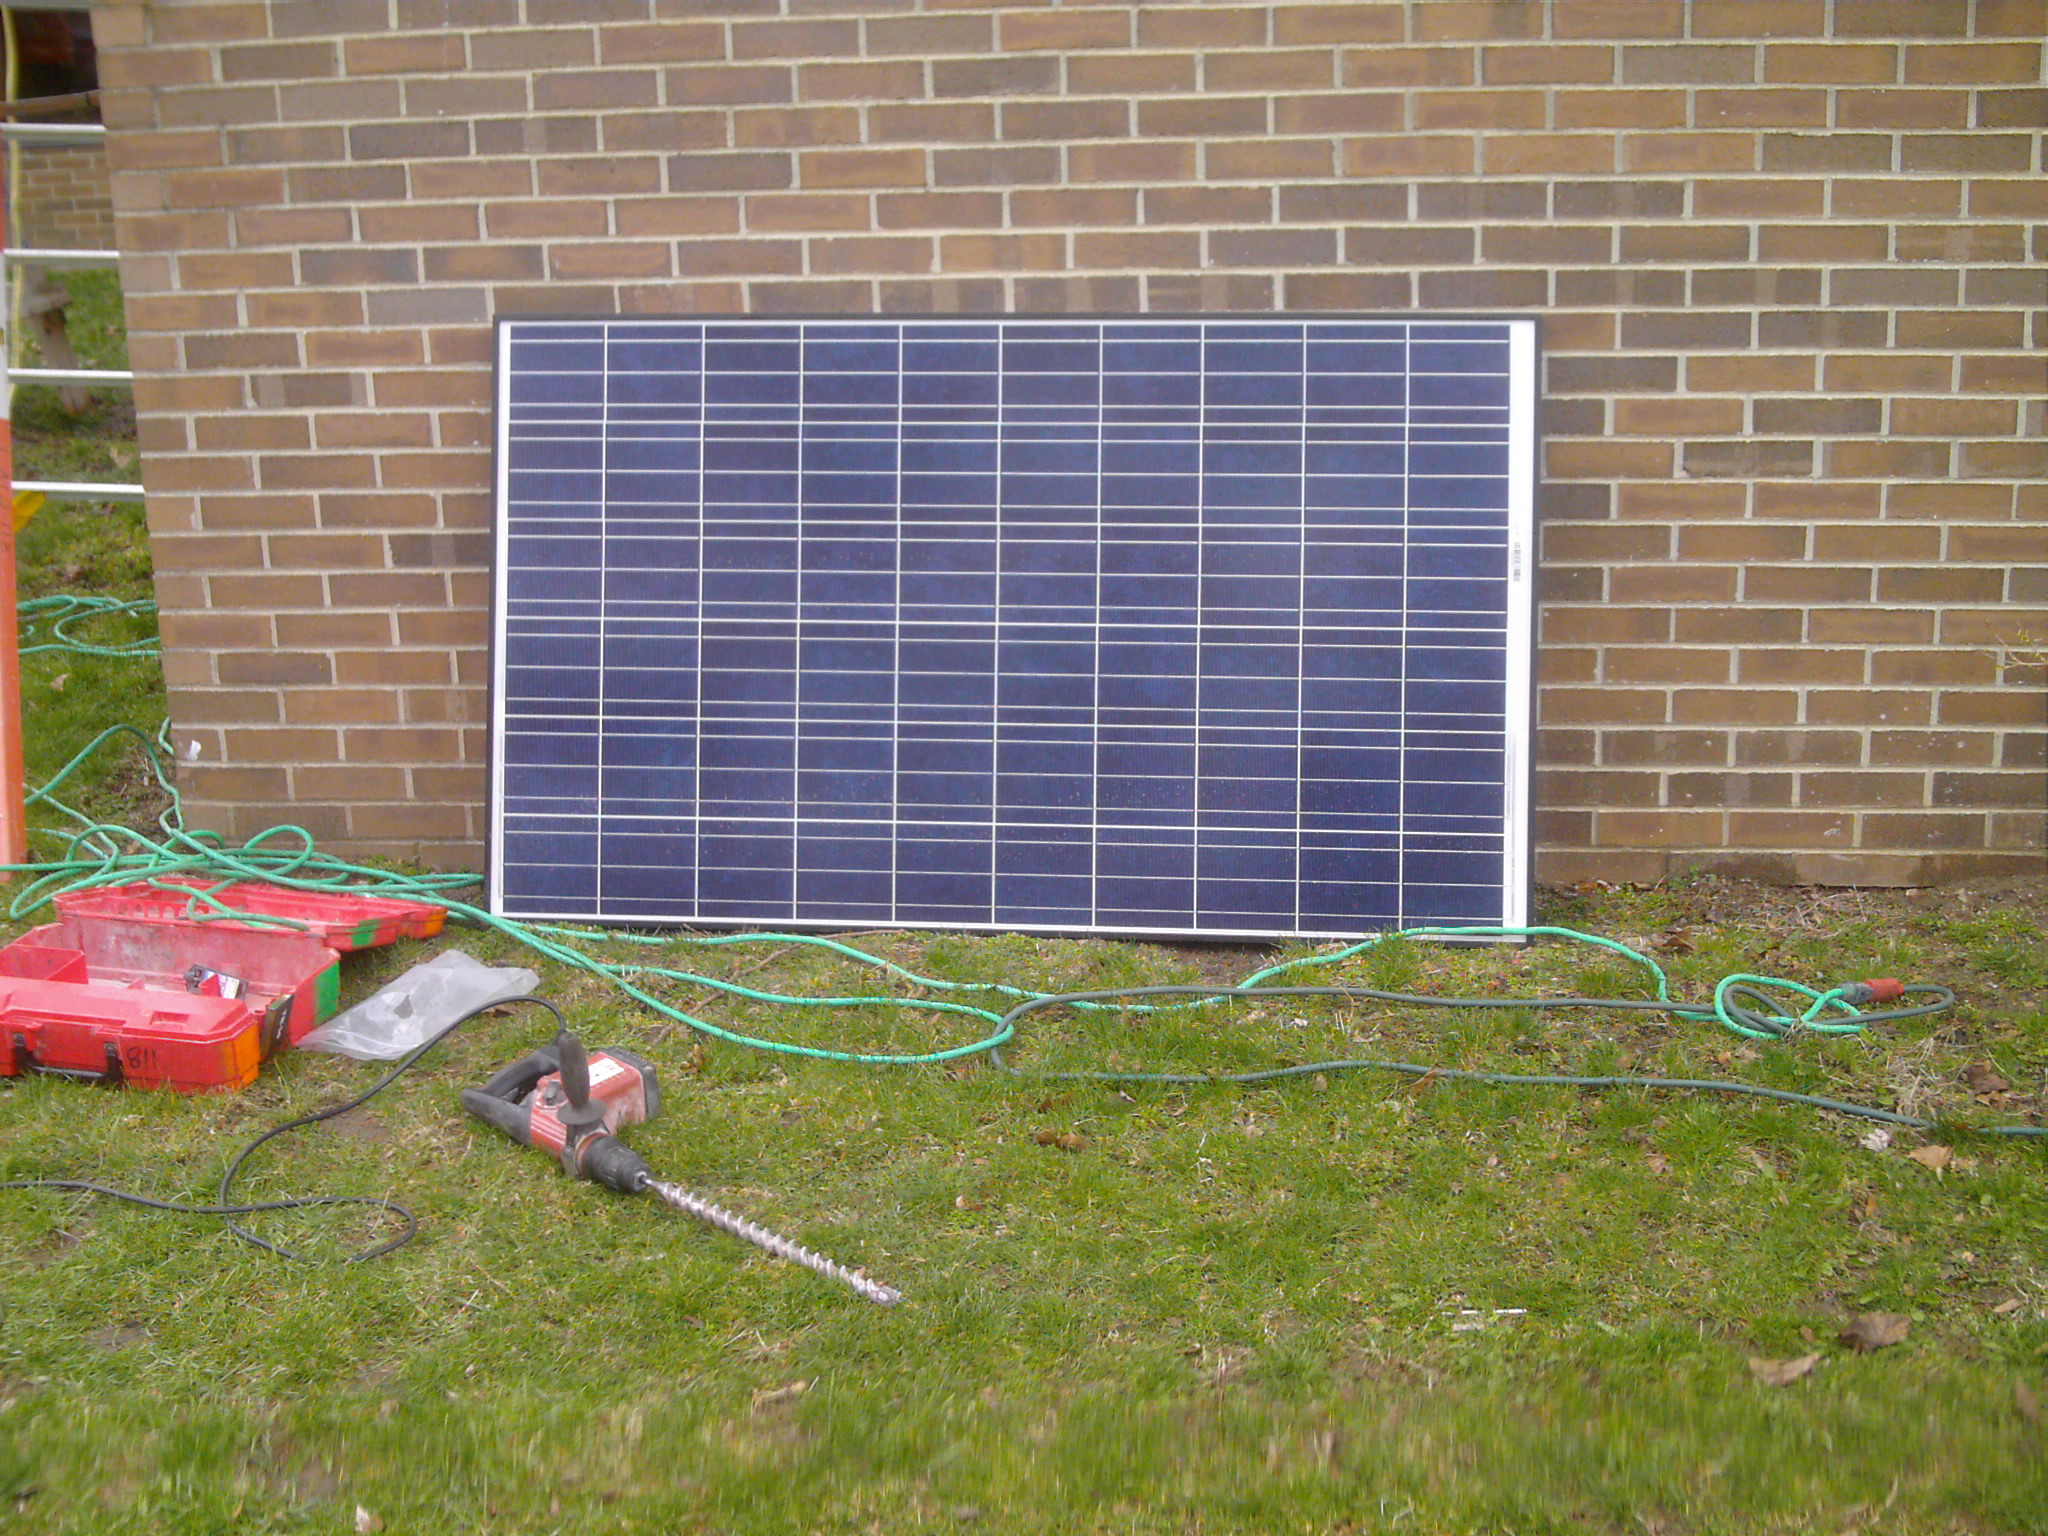
Solar Panel Installation

Solar Panel Installation
Solar Panel Installation
Solar Panel Installation
Solar Panel Installation
Solar Panel Installation

Solar Panel Installation
Solar Panel Installation

Solar Panel Installation
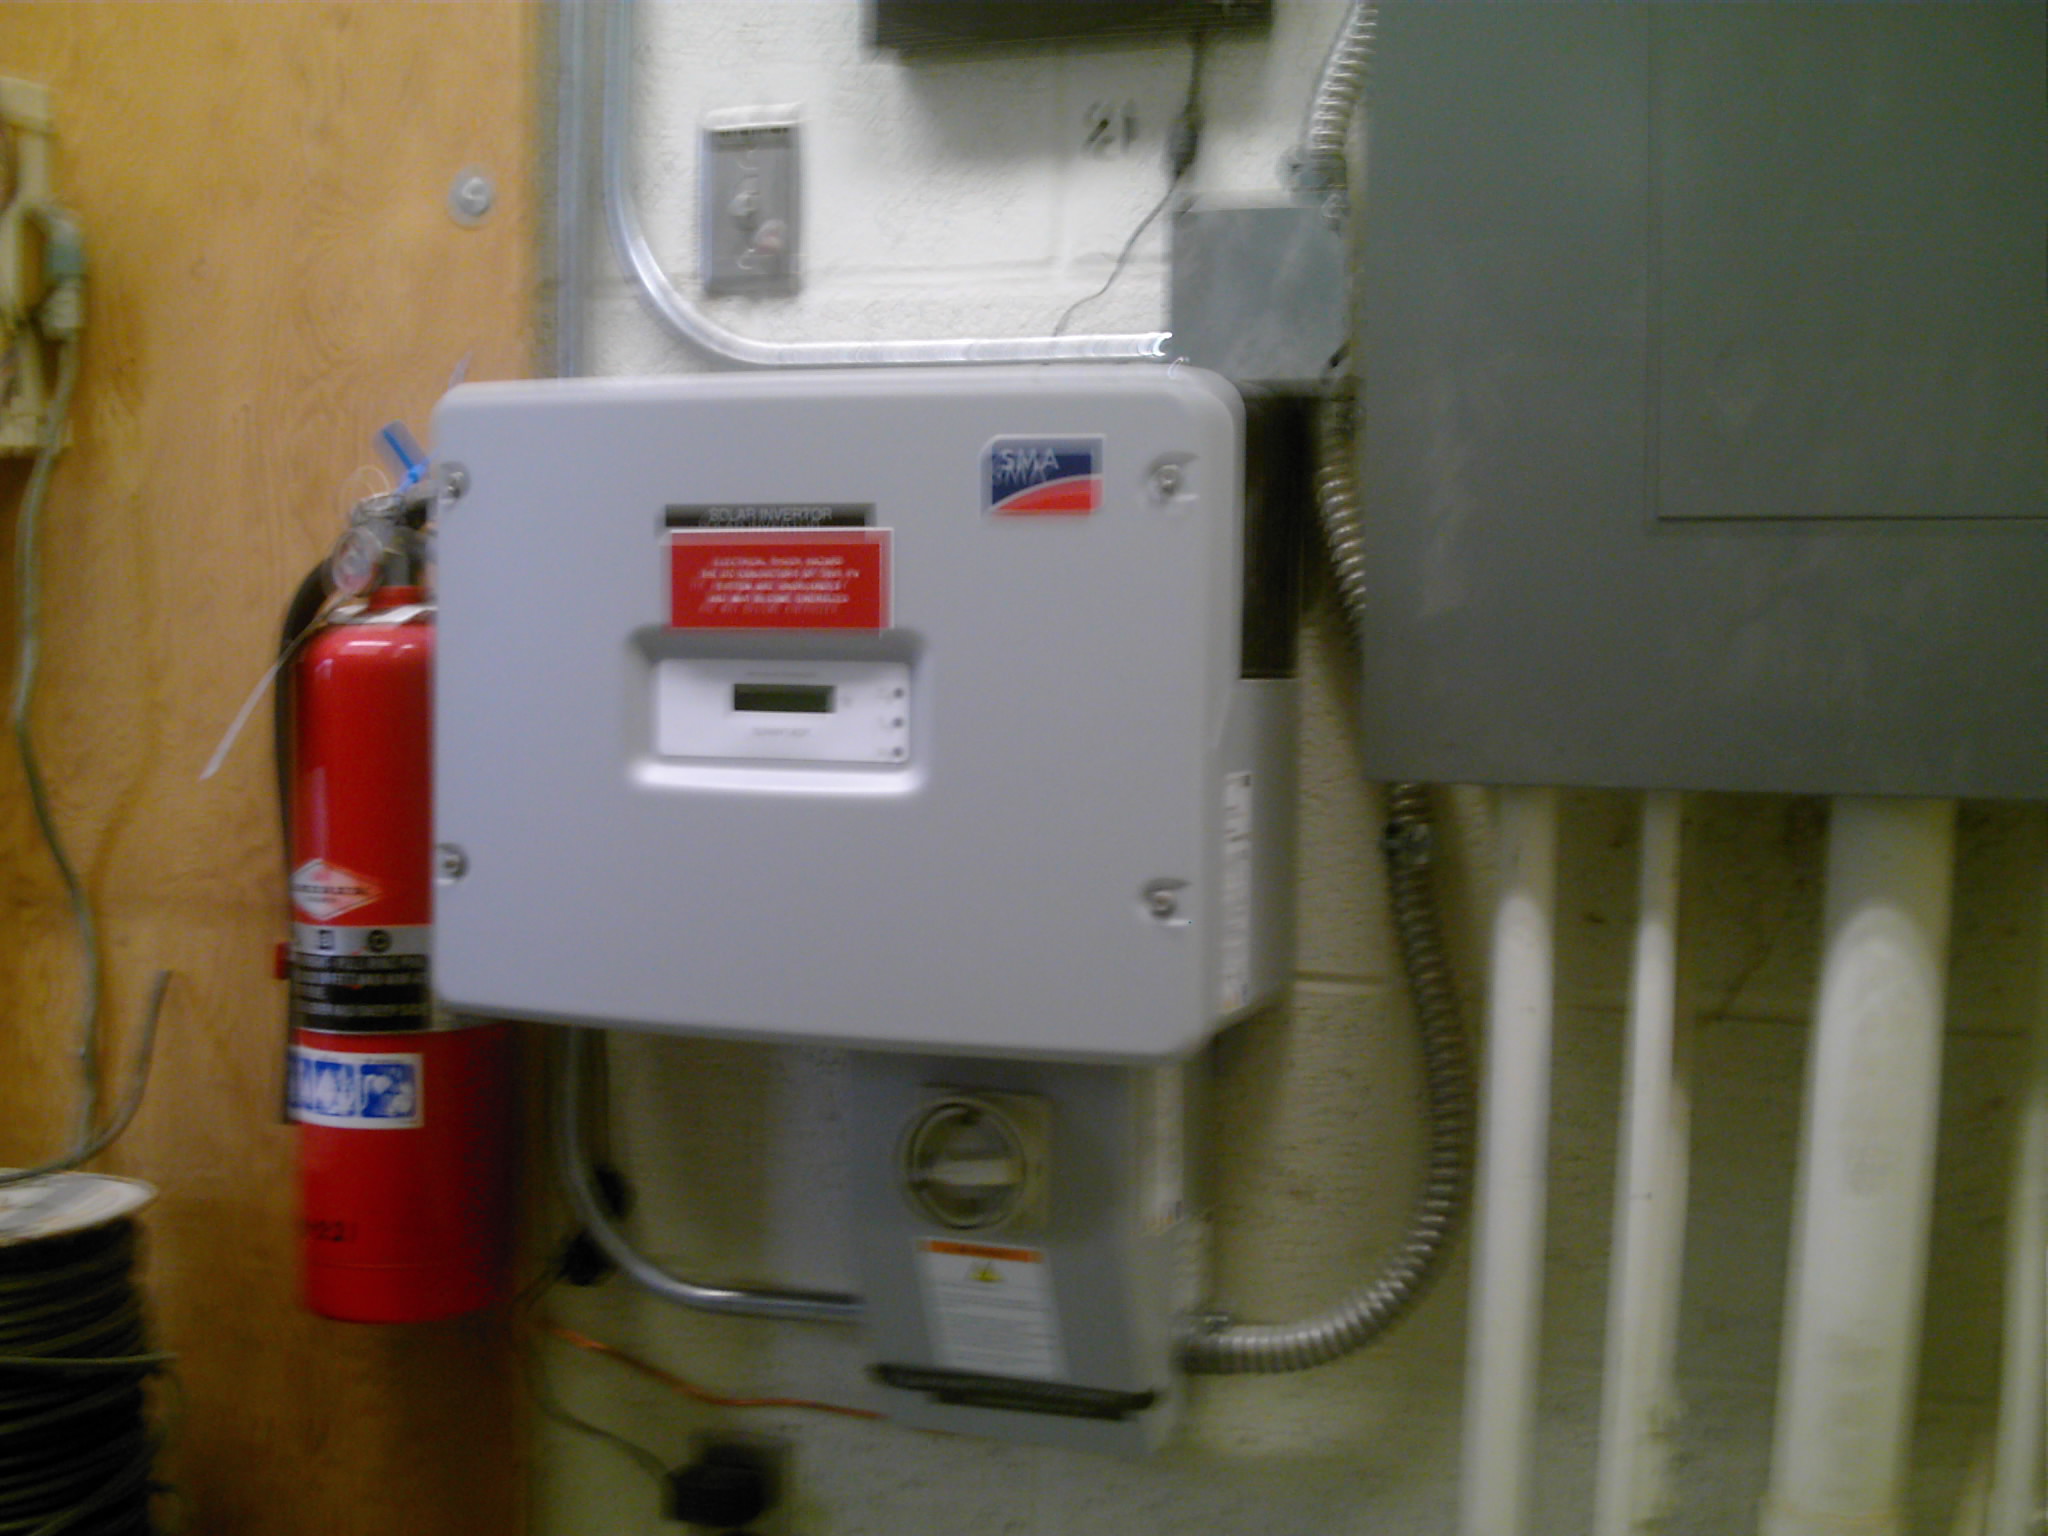
Inverter