1108 Georgina
This chart shows solar production in five-minute increments throughout the day.
Data Source
![]()
Data back until December 13, 2014
This chart shows solar production during the given year. The line chart has daily generation totals and the bar chart has monthly generation totals.
Data Source
![]()
Data back until December 13, 2014
Installation Specifics
- Installation Type
- Private
- Installation Completed
- 7/28/2010
- Number/Type of Panels
- 32 PHONO 240 watt  Mono Crystalline panels
- Install Specs
- 18° facing West
- Size/Type of Inverter
- 32 Enphase M190 microinverters
- Installer
- Heartland Electric
- Rated Output
- 7680 W
- Contact
- Tim Claborn
Images
Click on an image for a larger view
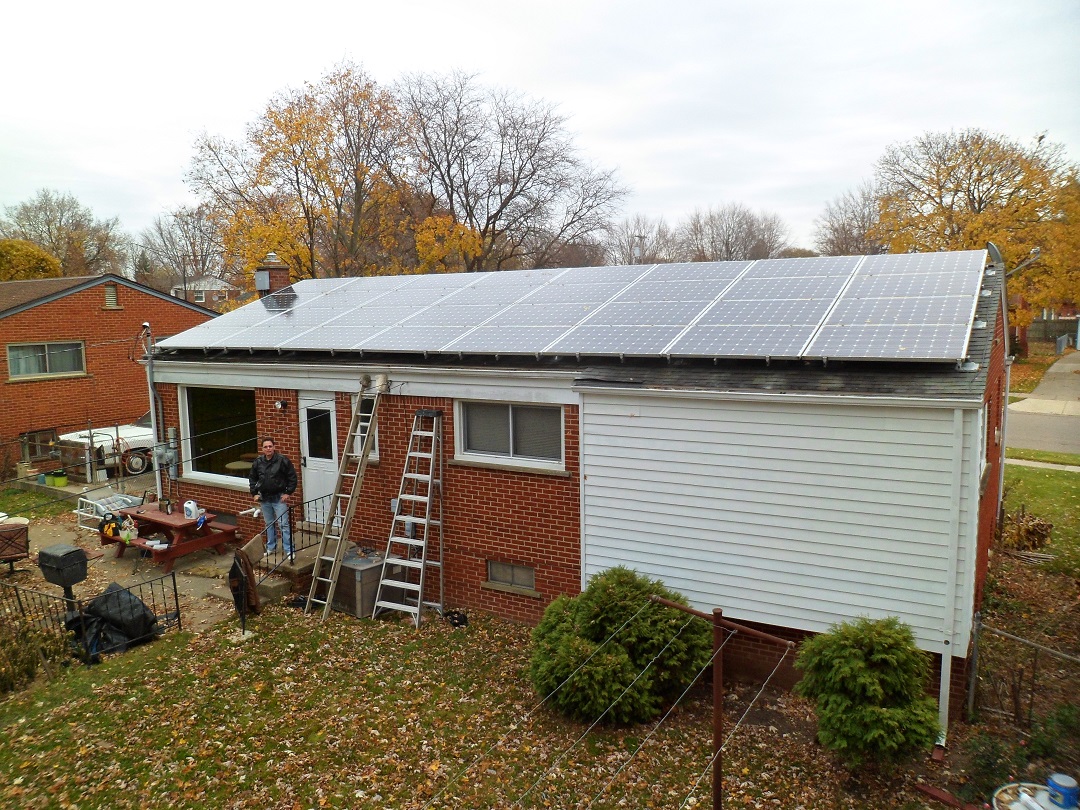
Solar panels on the roof
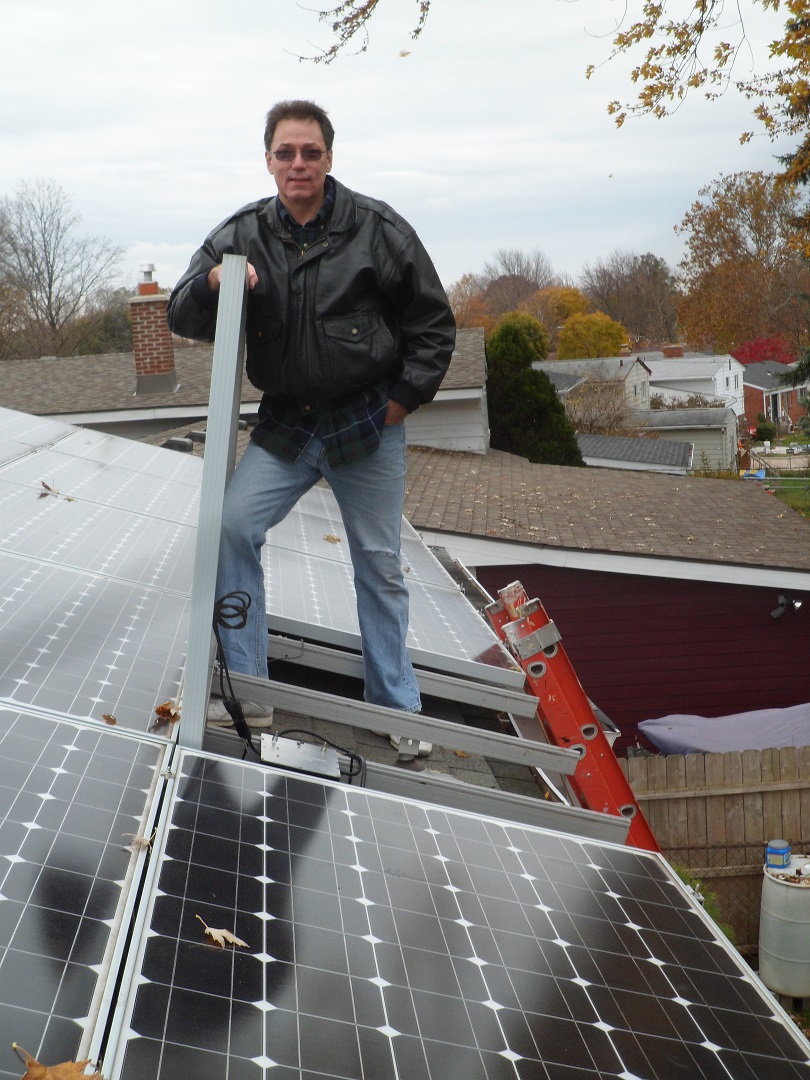
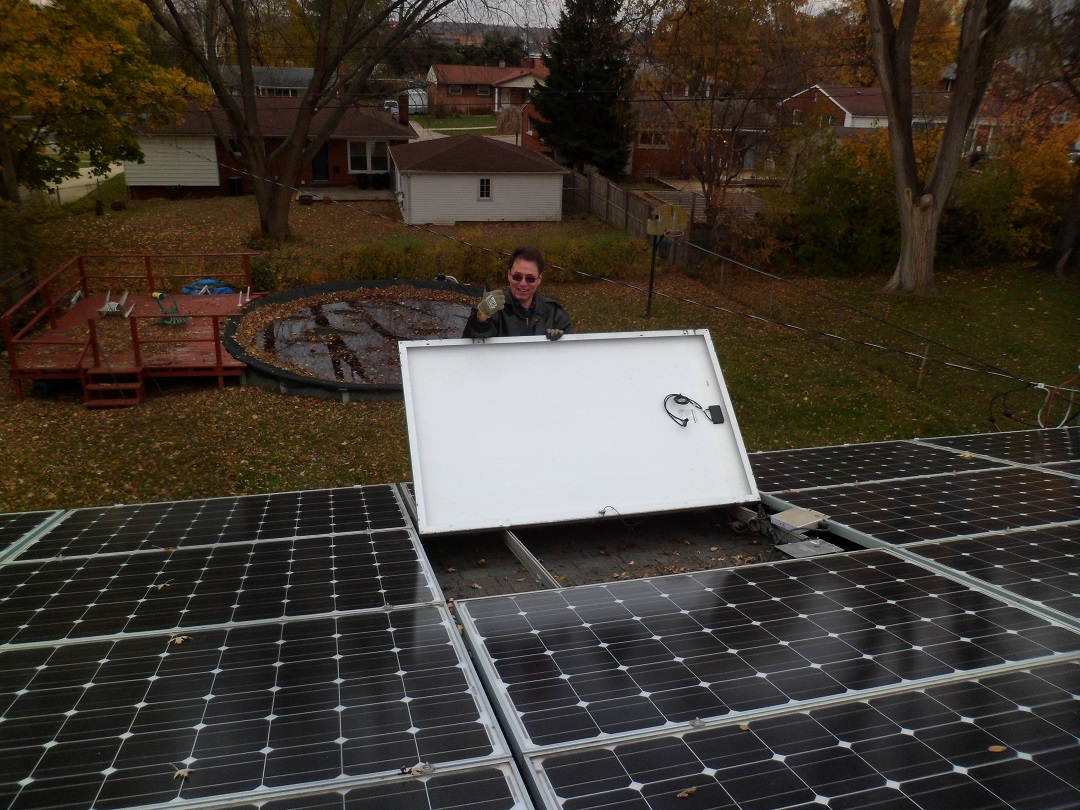
Homeowner replacing a micro-inverter
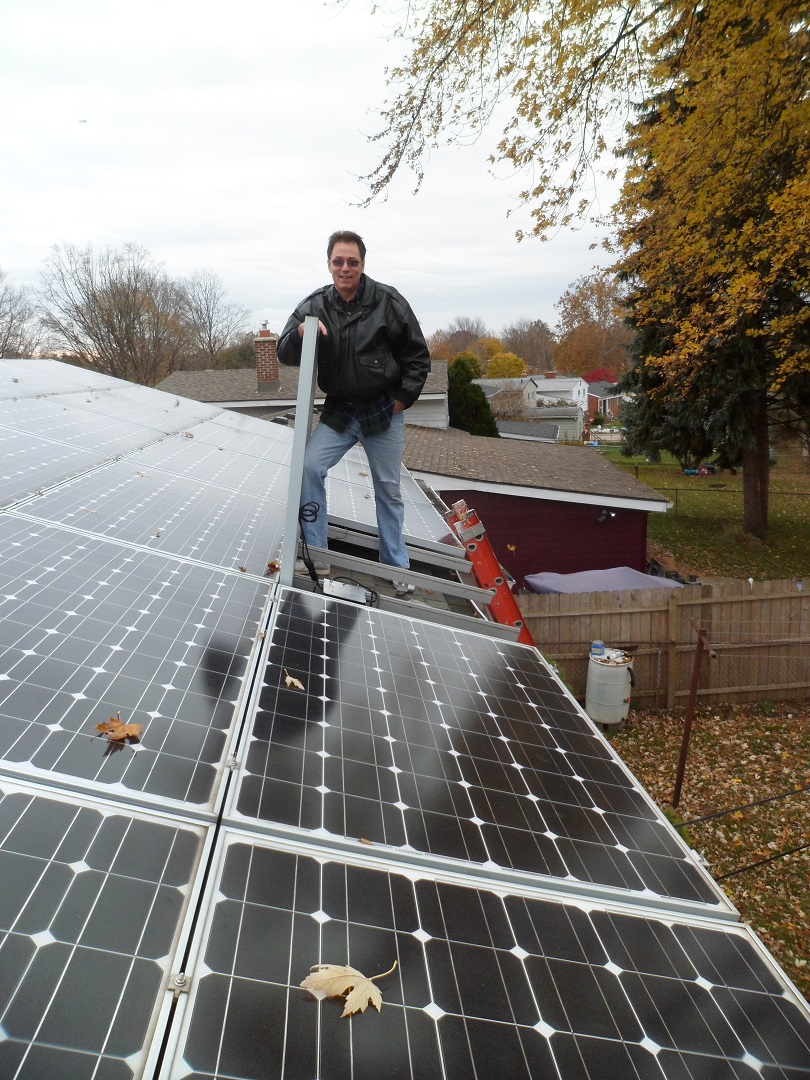
Homeowner replacing a micro-inverter
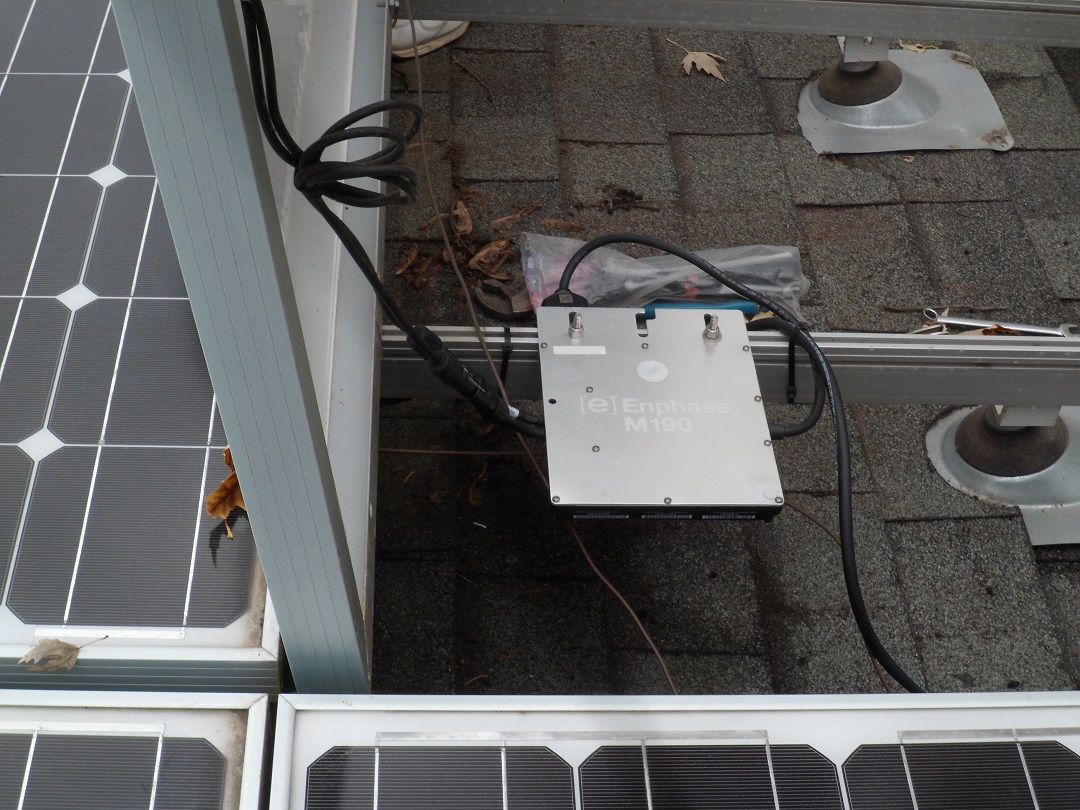
Brand new M190 micro-inverter
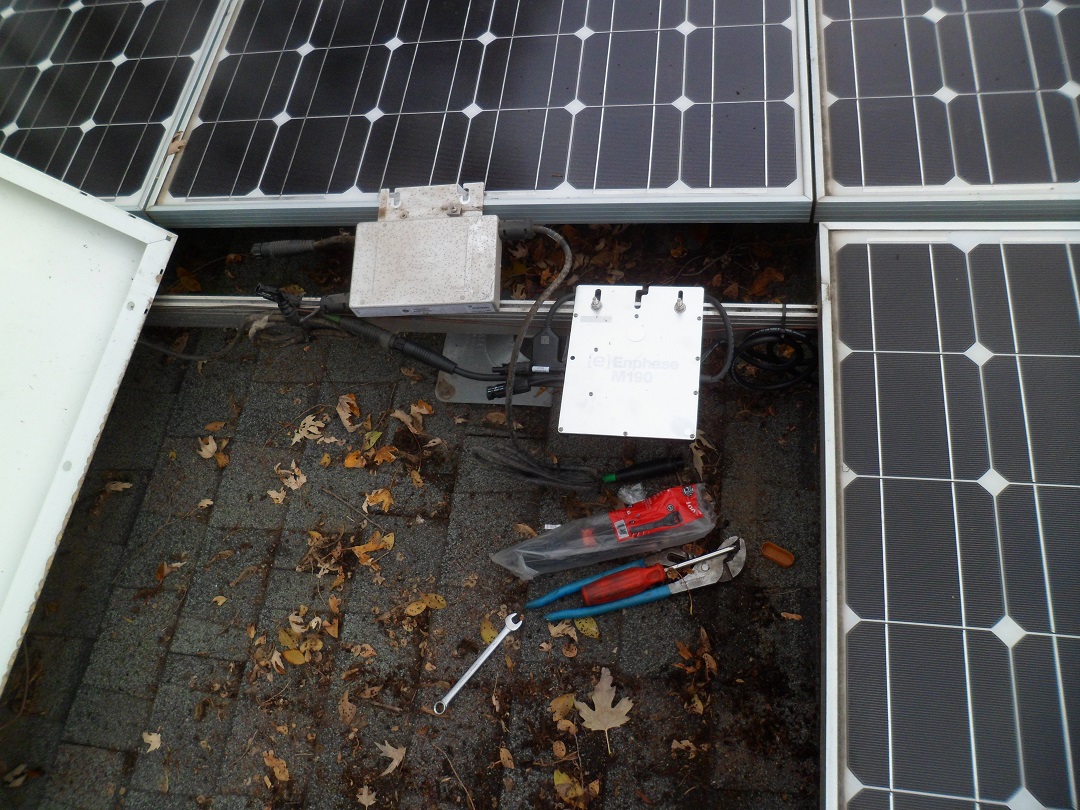
Brand new M190 micro-inverter
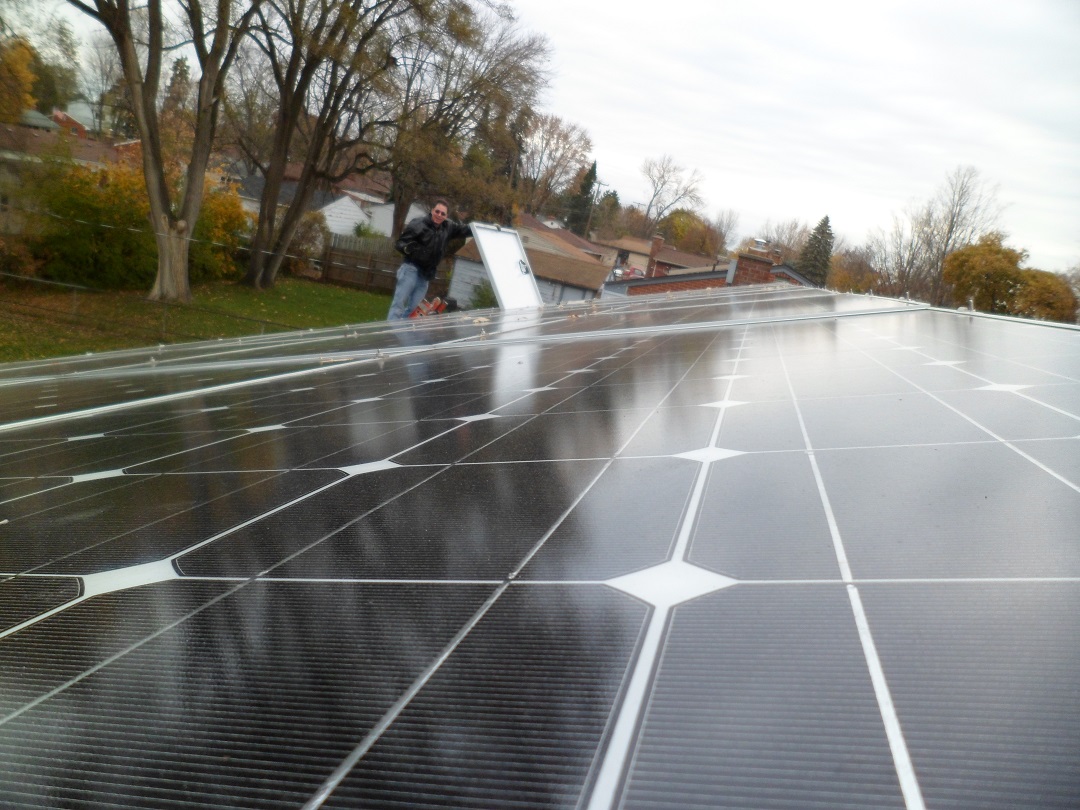
Swapping micro-inverter in the center of an array

32 (8 by 4) solar panels on the roof
Solar panels on the roof
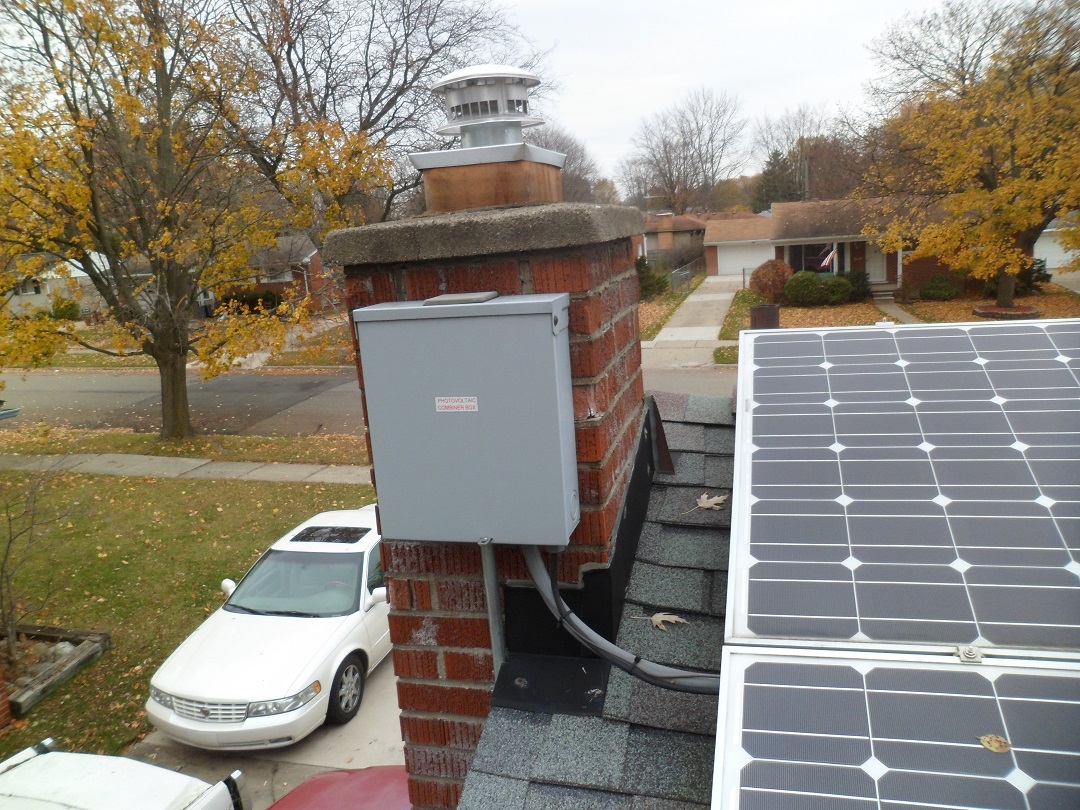
Combiner box on the back of the chimney
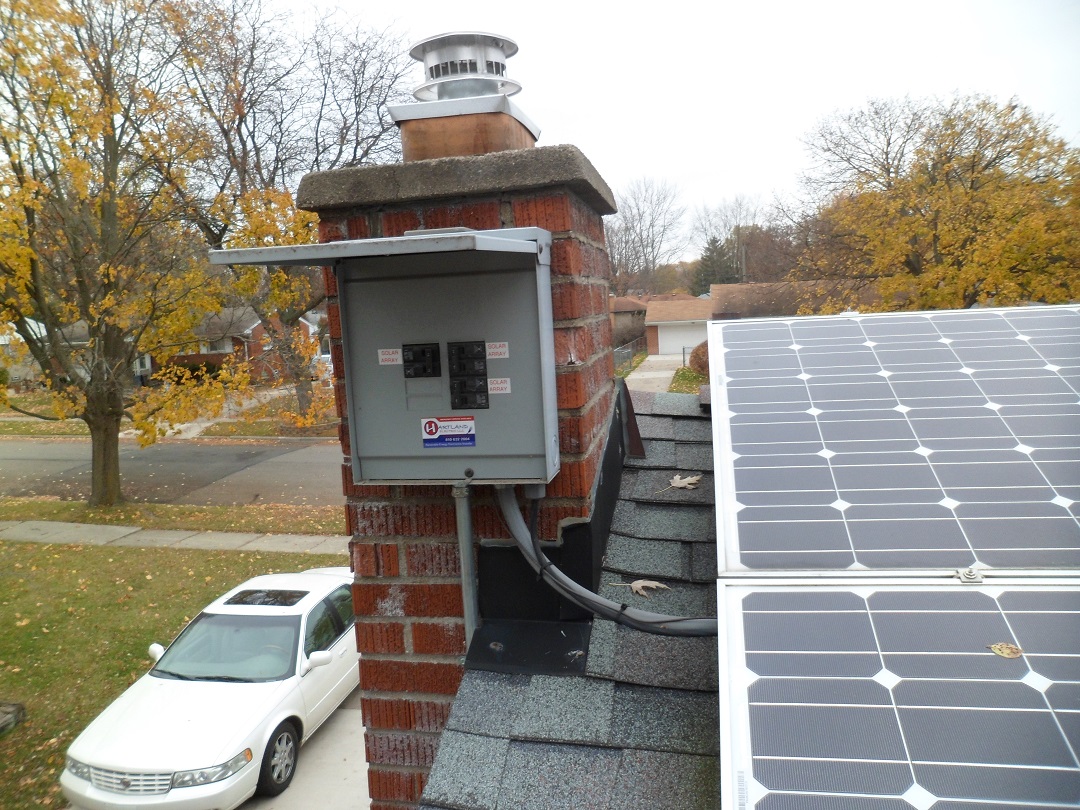
Combiner box on the back of the chimney
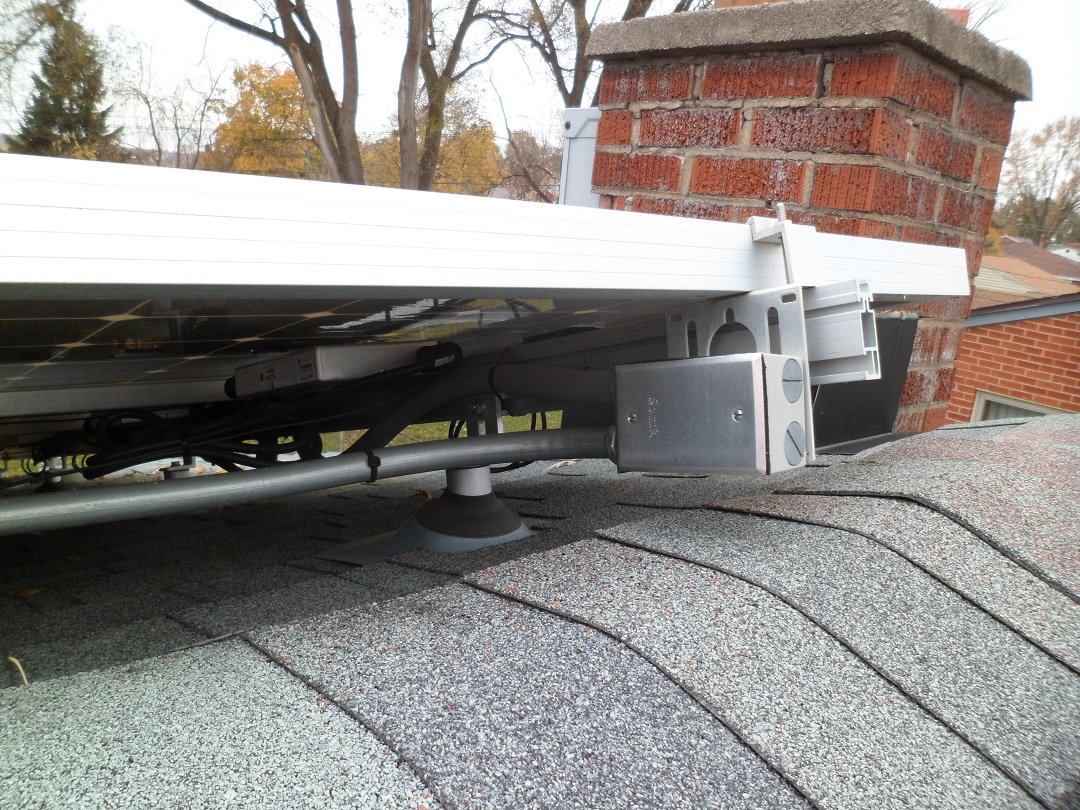
Junction box under solar panels
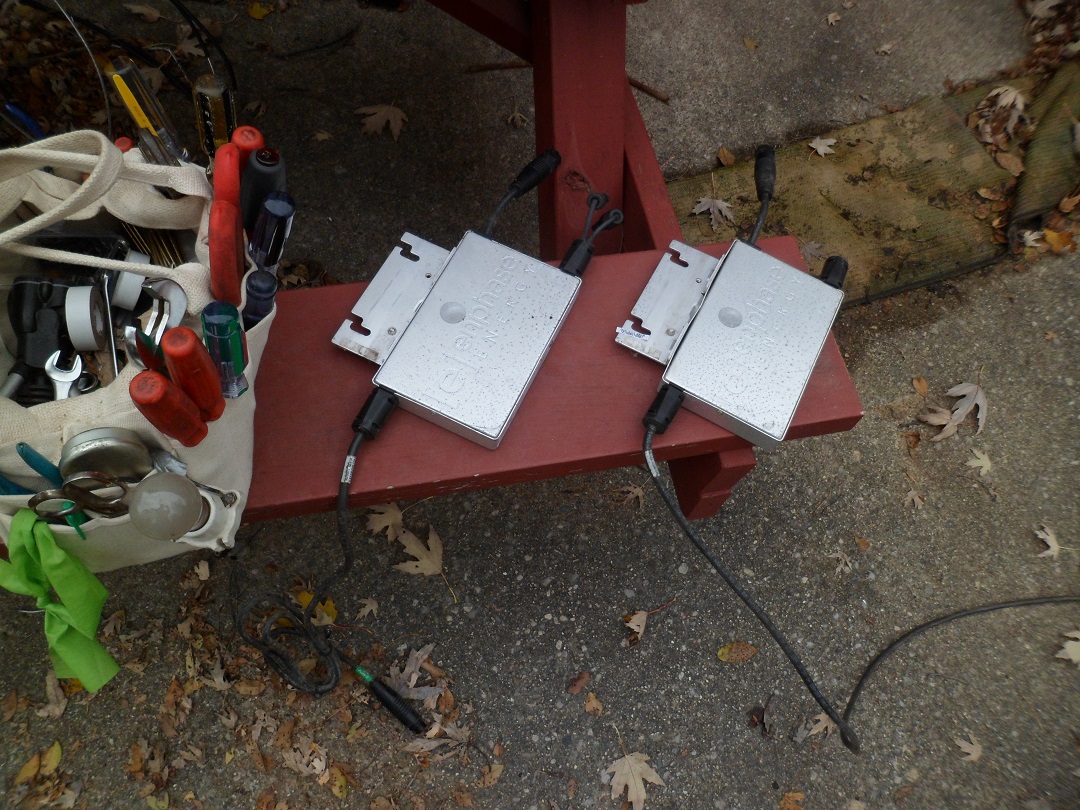
Bad inverters ready to be shipped back
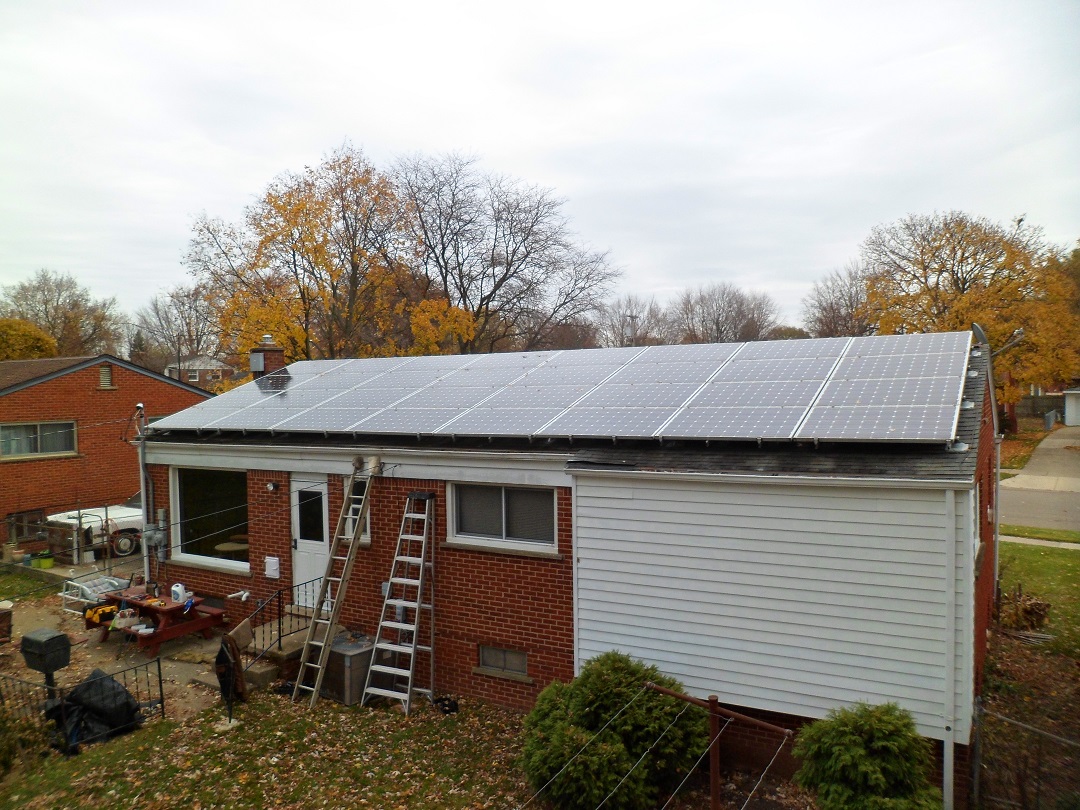
Solar panels on the roof

Bidirectional and "on demand" electric meters
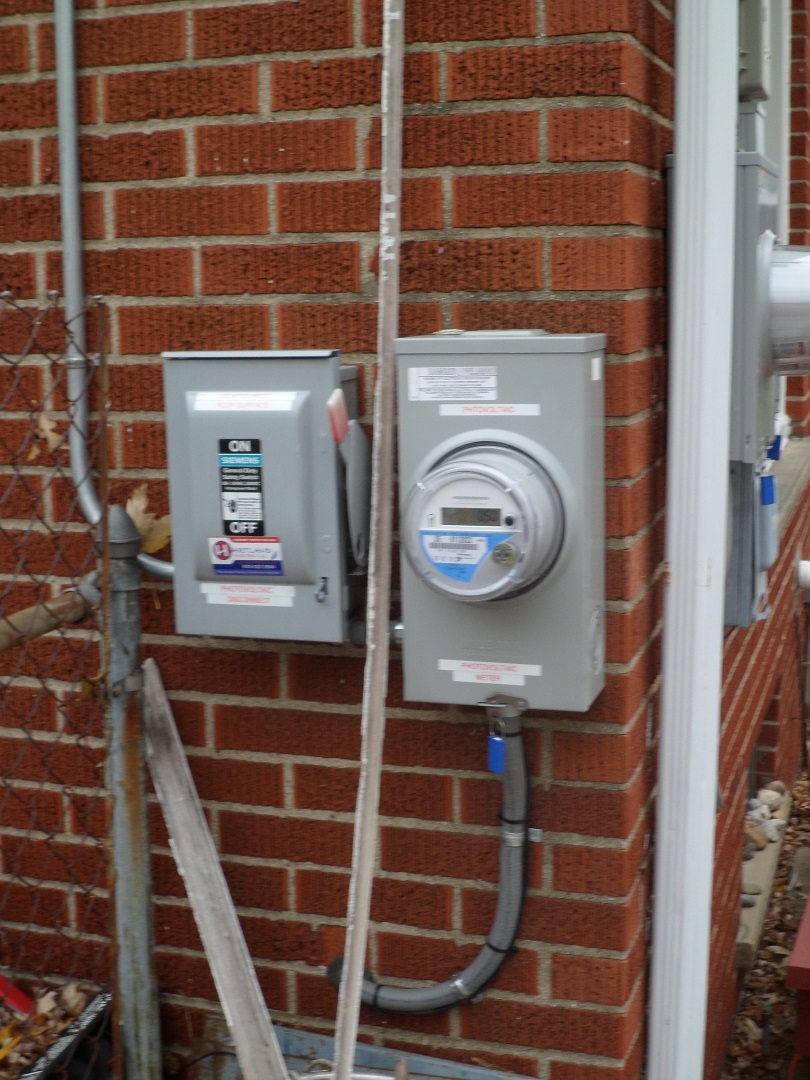
Solar disconnect and generation meter
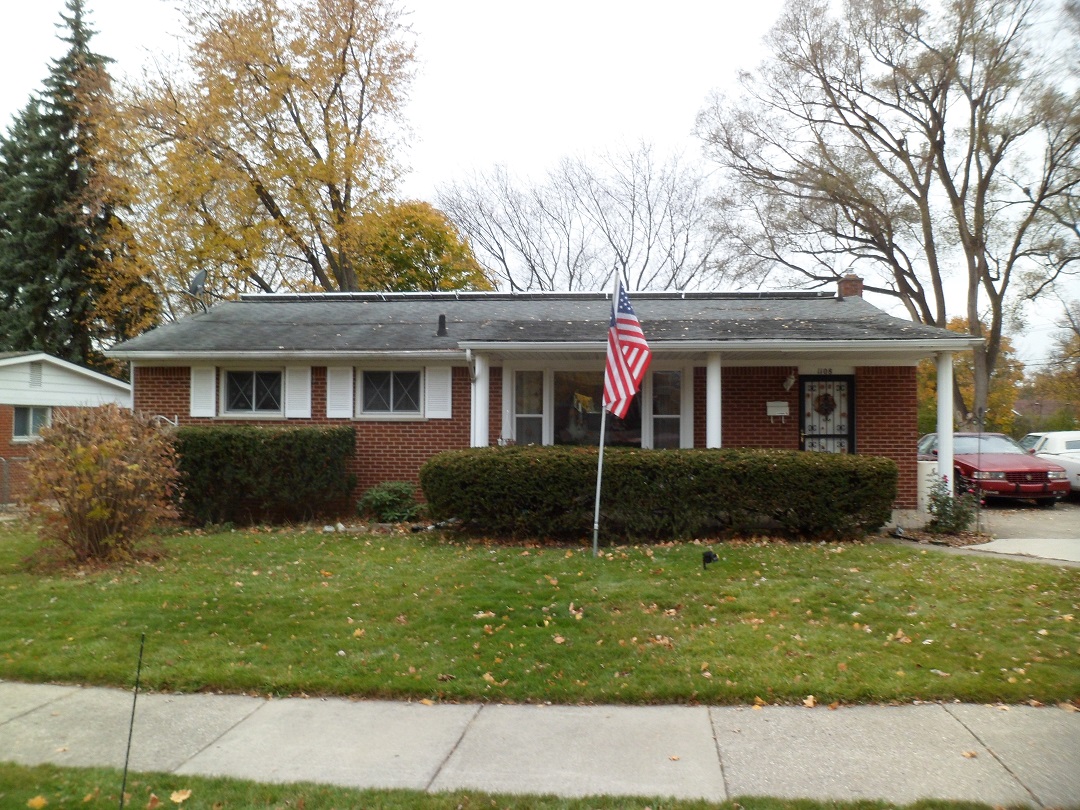
Front of the home